MORE INVENTORY, FEWER SALES
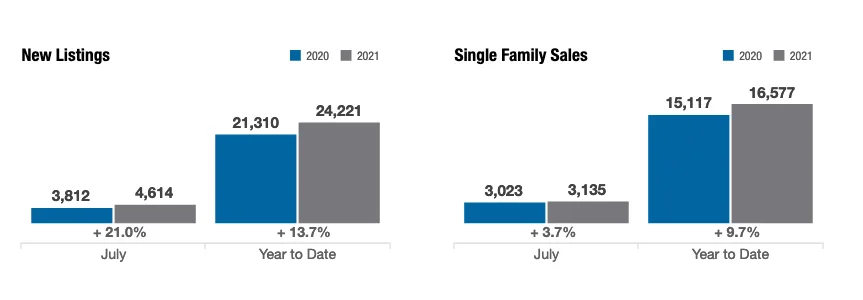
For the fourth consecutive month, new listings increased by over 20 percent. Given the lack of inventory needed to meet demand for the last few years, double-digit increases in new listings have been accompanied by a corresponding increase in home sales.
But that wasn’t the case in July according to the Columbus REALTORS® Multiple Listing Service.
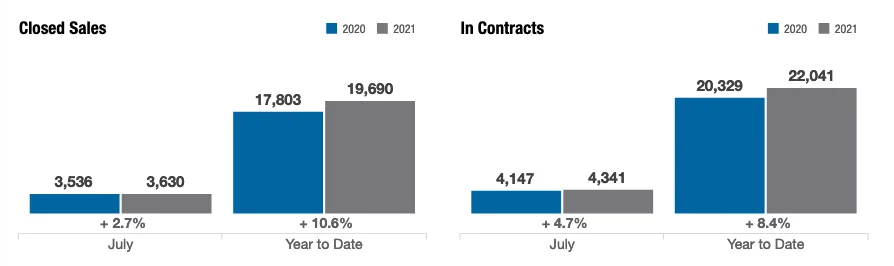
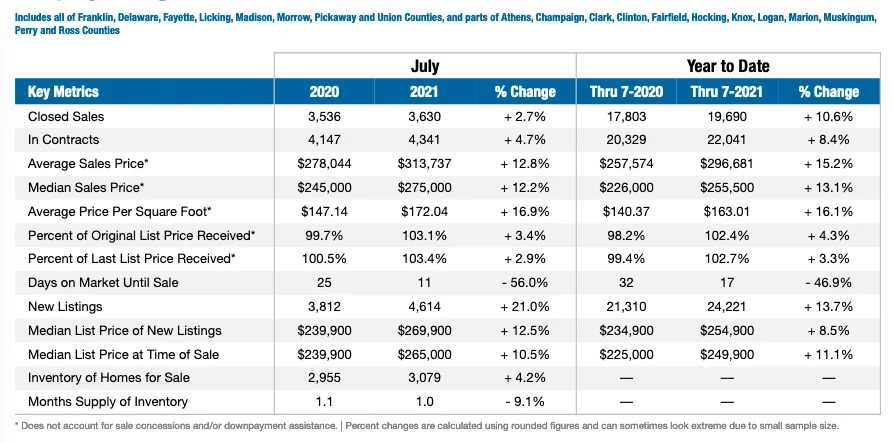
There were 4,612 homes added to the central Ohio market last month, which was an increase of 21.0 percent from last year. However, at 3,630, the number of home sales only increased 2.7 percent – a marked change from the double-digit increases seen in eight of the last 10 months.
We might be seeing a change in the pace of housing activity heading into the fall. This increase in inventory is giving buyers more choice. It’s also giving them considerably more flexibility in their options.
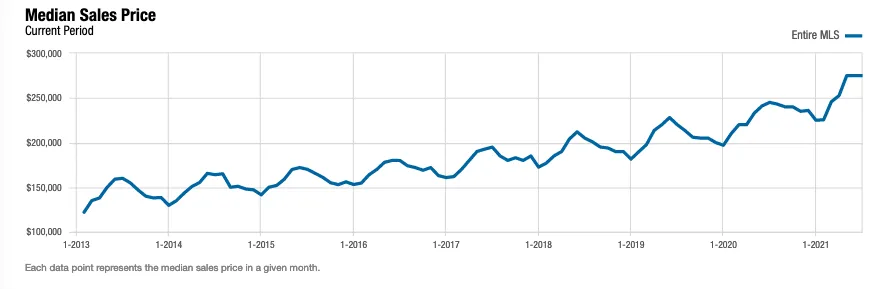
The average price of a home sold in July was $313,737, up 12.8 percent from July of 2020. The median sale price was up 12.2 percent to $275,000.
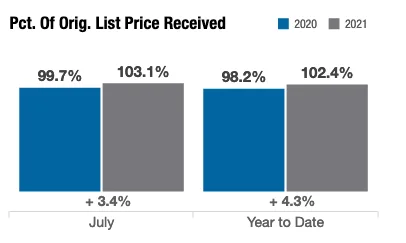
 Thus far in 2021, just under five percent of homes listed had list price increases prior to sale. However, 12.6 percent of homes needed a decrease in the list price in order to sell.
These price adjustments have trended down since the beginning of the year. Last month, just under 15 percent of homes saw price adjustments, whereas in January, 27.2 percent of homes had an adjustment to their price prior to sale.
As realtors, the Van Steyn Partners recommend pricing homes at market value. If today’s market supports a higher value, we will see that in the offers.
The time it took to sell a home remained at 11 days last month.
Homes under $350,000 sold in an average of 9 days. Homes sold between $350,000 and $500,000 took about 12 days to sell. Homes in the $500,000 to $700,000 price range sold in an average of 15 days, and homes over $700,000 were on the market for an average of 18 days.
 For the first seven months of 2021, homes have sold in an average of 17 days. Breaking this down by price range, homes under $350,000 sold in an average of 14 days. Homes priced $350,000 -$500,000 took 18 days. Homes between $500,000 and $700,000 took 27 days to sell and homes over $700,000 sold in an average of 40 days.
Columbus REALTORS® is comprised of almost 9,400 real estate professionals engaged in residential sales and leasing, commercial sales and leasing, property management, appraisal, consultation, real estate syndication, land development and more.
The Columbus REALTORS® Multiple Listing Service (MLS) serves all of Franklin, Delaware, Fayette, Licking, Madison, Marion, Morrow, Pickaway and Union Counties and parts of Athens, Champaign, Clark, Clinton, Fairfield, Hocking, Knox, Logan, Muskingum, Perry and Ross counties.
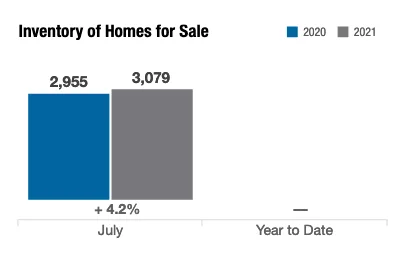
 There were 5,009 homes for sale in July 2021
 The Average Price per square foot in July 2021 was $172.04
This price is $10 per square feet more expensive compared to the same time last year
 The average real estate listing stayed on the market for just 11 days in July 2021
The average sale price for these listings was $313,737 (up 12.8% from last year)
The median sale price for these listings was $275,000 (up 12.2% from last year)
See the graph below to see how the median sale price has changed, year over year, since 2013 in Columbus